Keep your unified communications running smoothly with a solution that enables service quality through proactive analytics, resulting in improved user experience and reduced operational costs. From monitoring Session Initiation Protocol (SIP) trunk groups for performance to analyzing call detailed records (CDRs), Ribbon’s suite of intelligent operations applications is a rich toolbox of capabilities. Operations Applications enable you to turn Key Performance Indicators (KPIs) into a better Quality of Experience (QoE) for you and your customers, while at the same time providing measurable advances in operational costs.
The Ribbon Operations Applications suite includes:
Discover
Discover, is a powerful tool for visualizing, analyzing and troubleshooting communication network performance. With Discover, you will be able to perform retrospective root cause analysis with historical data, identifying key network trends and issues that occur over periods of time.
Finding and solving unified communication network issues can be difficult or non-existent without the proper tools for end-to-end views. Discover enables network wide troubleshooting and alerting capabilities on based on KPIs and other metrics that cross thresholds. Enterprises can quickly identify Quality of Experience (QoE) issues surfaced by multiple dimensions, isolate and drill down on network problems, and ensure quality for your employees or customers.
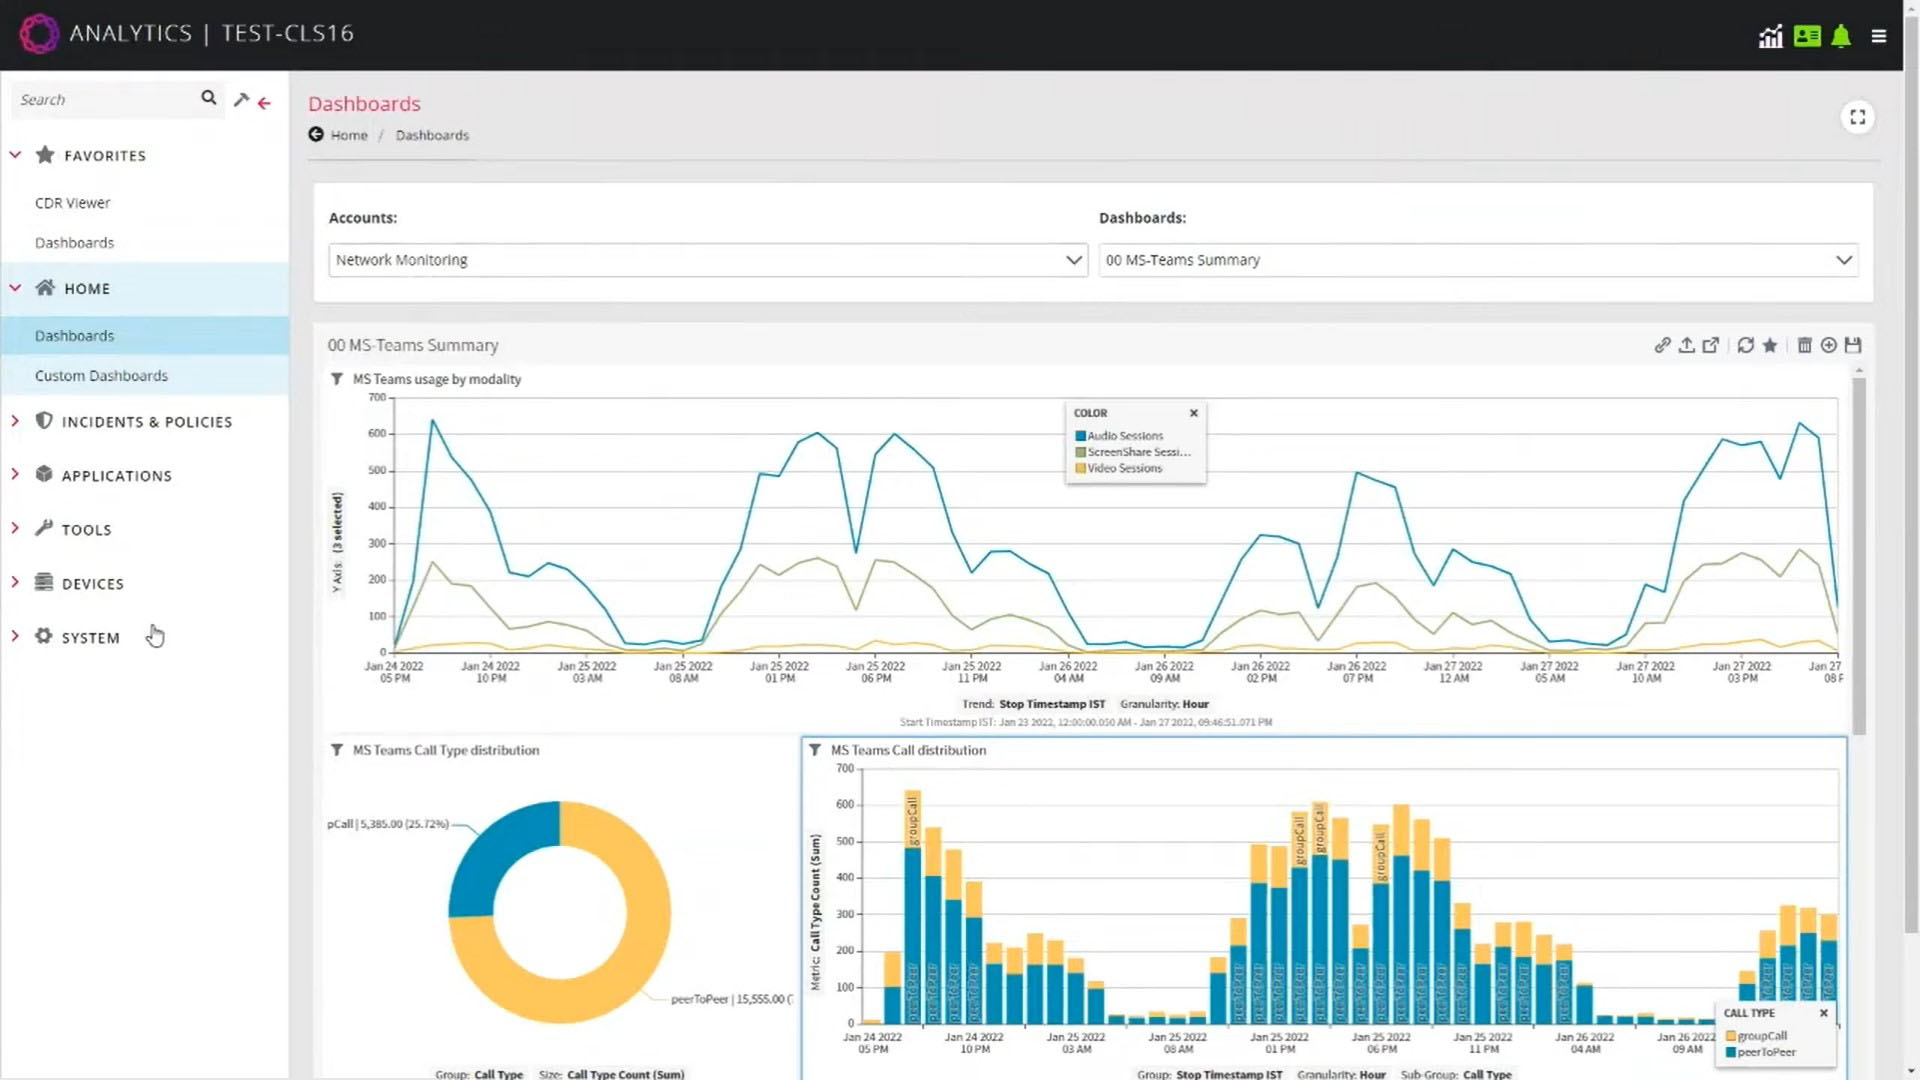
Discover has an interactive and intuitive user interface displaying vital network KPIs with advanced and customizable reporting dashboards. You can add as many dashboards as you need and display them in a wide variety of formats. Discover allows you to quickly build, edit, and filter dashboards as well as strategically re-position them in any manner that your network operations staff requires.
Discover also provides end-to-end SIP call ladder diagrams to visualize and troubleshoot the flow of SIP packets between different UC network elements. Through a combination of filters, labels, ordering, and narrowing-down of the traffic data, you can generate an easy-to-follow view across disparate network elements for debugging and traffic analysis.


